WindRose PRO Help
by Enviroware srl
Load from MS Excel files
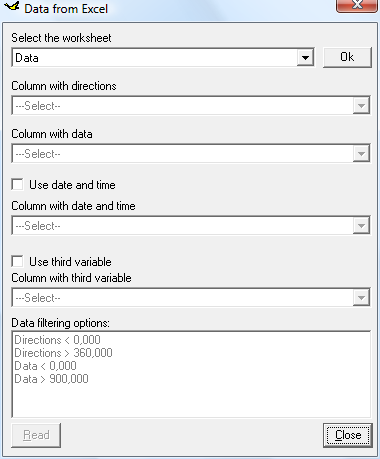
The data organised in records can also be read from MS Excel files. In this case, the file must have a sheet containing directions and corresponding values in two different columns. A difference between the ASCII CSV input file and the MS Excel file is that the latter requires a header row with the names of the variables. The user then selects the two columns with directions and data by means of the mask represented in the following figure. The user may select the sheet contaiing the data then, after clicking the Ok button, may select the columns containing the variables.
Two new features have been introduced with version 2.3.x:
- The user may select a column containing date and time of each measurement. This new feature allows to filter the data to be analysed according to year, month, hour of the day, or day/night hours. Moreover WindRose automatically calculates the Typical day.
- The user may select a column containing a third variable (e.g. pollutant concentration, temperature, etc.) which will be used to generate the raw data plot.
Note that MS Excel must be installed on the user's computer.
An example of MS Excel input file is contained under the directory Sample of the installation path, and is called sample.xls.
Please note that the wind direction must always be in degrees (do not use radians), while the units of the second variable are known by the user and not used by WindRose PRO.
After loading the data, the total number of data and the total number of valid data, together with the percentage, appear in the lower right corner of the main mask. The number of valid data is determined using the filtering options specified by the user.
When loading an Excel file, if you modify the filtering options, you must reload the data.
Introduction:
Basics:
- System requirements
- Installation
- License agreement
- Ordering information
- Download
- Evaluation
- Registration
- Support and questions
- Technical warranty
Tutorial:
- Graphical interface
- Load
- Comma separated values
- Excel files
- AERMOD files
- ISC3ST files
- ASCII files
- EnergyPlus Weather
- Frequencies
- Analyse
- Draw
- Chart
- Copy
- Output
- Excel
- DXF
- KML
- SHP
- Save
- Options
- About
- Help
- Quit
- Check for updates