WindRose PRO Help
by Enviroware srl
Directions & type
The Directions & Type tab of the Options form allows the user to specify how many directions must be considered for the wind rose. The default is 16, but it is also possible to choose 4 and 8.
This tab allows also to specify the type of plot to produce, among wind rose, raw data and spaghetti (rays). If the user selects wind rose, it is also possible to indicate if it must have spaces between its "arms" or not.
It is also possible to specify if wind roses of minimum, average and maximum speeds per direction must be produced. Please note that if you select Minimum, Maximum and Mean, they will be produced over the same plot, and the scale will be adapted to the maximum speed, therefore the minimum speed might not be visible very well. To avoid this problem you can select to produce plot of minimum speeds only. Be aware that if the speeds are zero for all the directions, the plot will be not produced.
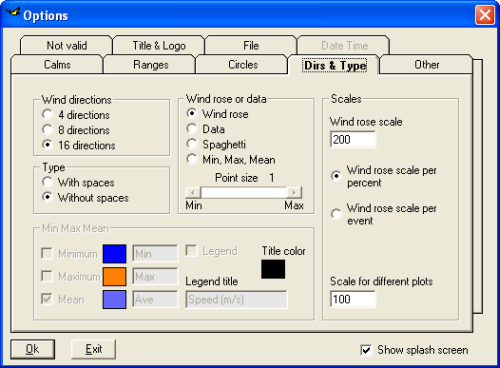
It is possible to specify a scale for the wind rose, and a different scale for the other plots (raw data, average speed, etc.). The wind rose scale can be expressed as number of points per percent of data, or as number of points per event. In order to compare different wind roses, the same scale in terms of number of points per percent of data must be used. For the other types of plots the scale indicates the number of points per unit of data, for example number of points per 1 m/s when plotting the average wind speed.
When the scale is too big (i.e. the plot is only partialli visible on the interface), or when it is too small (i.e. the plot is not clearly visible), WindRose PRO shows a warning message and suggests a possible scale.
Starting from version 2.3.x, it is possible to read a third variable from MS Excel and to produce raw data plot depending on direction and the values of the two variables. An example is shown in the next figure, where points of different colors indicate different concentration intervals, which are plotted at different positions according to the values of wind direction and speed.

This tab allows also to specify the type of plot to produce, among wind rose, raw data and spaghetti (rays). If the user selects wind rose, it is also possible to indicate if it must have spaces between its "arms" or not.
It is also possible to specify if wind roses of minimum, average and maximum speeds per direction must be produced. Please note that if you select Minimum, Maximum and Mean, they will be produced over the same plot, and the scale will be adapted to the maximum speed, therefore the minimum speed might not be visible very well. To avoid this problem you can select to produce plot of minimum speeds only. Be aware that if the speeds are zero for all the directions, the plot will be not produced.
It is possible to specify a scale for the wind rose, and a different scale for the other plots (raw data, average speed, etc.). The wind rose scale can be expressed as number of points per percent of data, or as number of points per event. In order to compare different wind roses, the same scale in terms of number of points per percent of data must be used. For the other types of plots the scale indicates the number of points per unit of data, for example number of points per 1 m/s when plotting the average wind speed.
When the scale is too big (i.e. the plot is only partialli visible on the interface), or when it is too small (i.e. the plot is not clearly visible), WindRose PRO shows a warning message and suggests a possible scale.
Starting from version 2.3.x, it is possible to read a third variable from MS Excel and to produce raw data plot depending on direction and the values of the two variables. An example is shown in the next figure, where points of different colors indicate different concentration intervals, which are plotted at different positions according to the values of wind direction and speed.
Introduction:
Basics:
- System requirements
- Installation
- License agreement
- Ordering information
- Download
- Evaluation
- Registration
- Support and questions
- Technical warranty
Tutorial:
- Graphical interface
- Load
- Comma separated values
- Excel files
- AERMOD files
- ISC3ST files
- ASCII files
- EnergyPlus Weather
- Frequencies
- Analyse
- Draw
- Chart
- Copy
- Output
- Excel
- DXF
- KML
- SHP
- Save
- Options
- About
- Help
- Quit
- Check for updates