Blog
Enviroware at NOSE 2024
Enviroware participated with two oral contributions to the international conference NOSE 2024 on Environmental Monitoring of Oudors and VOCs, held in Naples, Italy, 15-18 September 2024
Read more...
International Handbook on the Assessment of Odour Exposure using Dispersion Modelling
The Handbook is a collaborative work by more than 50 international odour experts from seventeen countries. The document is downloadable free of charge. ISBN 978-84-09-52429-7.
Read more...
International Handbook on the Assessment of Odour Exposure using Dispersion Modelling - Second Draft
The second draft of the International Handbook on the Assessment of Odour Exposure using Dispersion Modelling is publicly available for comments. The due date for comments is July 9, 2023.
Read more...
Compiling AERMET 22112 with gfortran under Linux
AERMET 22112 is meteorological data preprocessor of AERMOD 22112, the preferred air quality dispersion model of US-EPA and it is used all over the world as reference model for regulatory purposes. US-EPA distributes the Fortran source code and an executable to be used with Microsoft Windows. In order to compile the distributed source code under Linux with the free GNU Fortran compiler gfortran it is necessary to make some fixes to the source code.
Read more...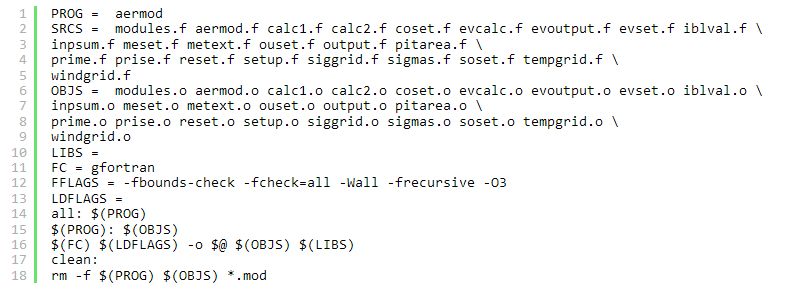
US EPA Releases AERMOD and AERMET Version 22112, and MMIF version 4.0
AERMOD 22112 is now the preferred air quality dispersion model of US-EPA and it is used all over the world as reference model for regulatory purposes.
On June 27, 2022, the U.S. EPA announced revisions to the AERMOD air dispersion model and its component AERMET, the meteorological data preprocessor.
These revisions include the update of AERMET and AERMOD from version 21112 to version 22112.
On the same date, the U.S. EPA announced the release of the meteorological data preprocessor MMIF 4.0.
Read more...
How to plot a windrose with Python
In this post we show how to produce a simple wind rose of AERMET meteorological surface data with Python, using the Windrose library. Other directional data can be plotted after changing the function that reads and parses the input file.
AERMET is the meteorological preprocessor of AERMOD, the US-EPA preferred air quality dispersion model for State Implementation Plan (SIP) revisions for existing sources and for New Source Review (NSR) and Prevention of Significant Deterioration (PSD) programs.
A wind rose is a chart which gives a view of how wind speed and wind direction are distributed at a particular location over a specific period of time. It is a very useful representation because a large quantity of data can be summarised in a single plot.
Read more...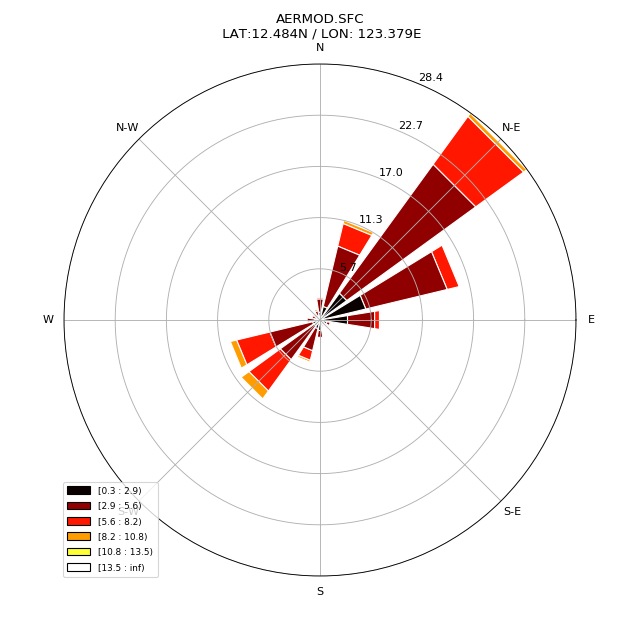
CALPUFF 7.3.2 BETA modeling system is available
A new version of the CALPUFF modeling system was relased October 1, 2019 (and updated February 6, 2020). Among the new features is the capability to deal with agricultural spray sources. Moreover, several bugs were corrected, including the known one about precipitation in CALWRF that might cause cumulation of values in 3D.DAT files generated from WRF output files.
Besides CALPUFF (version 7.3.2) and CALWRF (now version 2.0.3), the postprocessors CALPOST (version 7.2.0), CALSUM (version 7.1.0) and POSTUTIL (version 7.1.0) were updated.
Read more...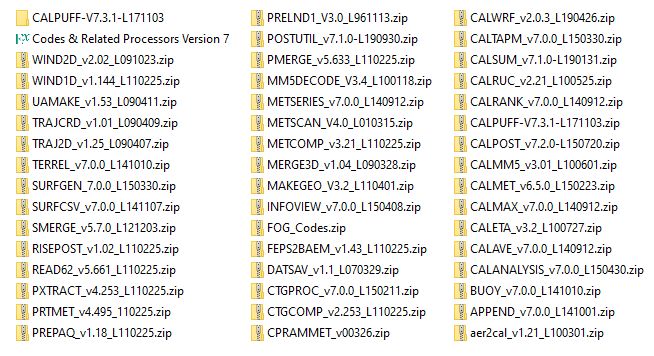
How to deal with GFS upgrades with WRF
From time to time, NCEP upgrades GFS products and this may have effects on running WRF in forecast or analysis mode.For example, NCEP upgraded GFS products from version 14 to 15.1 beginning with the 1200 UTC run on June 12, 2019. A similar change happened May 11, 2016 when vertical levels changed from 27 to 32.
Such upgrades do not affect forecasts when they happen if WPS/WRF 4.0 or higher is used. Using WRF 3.9 or older, requires to upgrade ungrib binary to v4.0 or higher.
However, a problem still exists if these products are used for analysis runs
Read more...
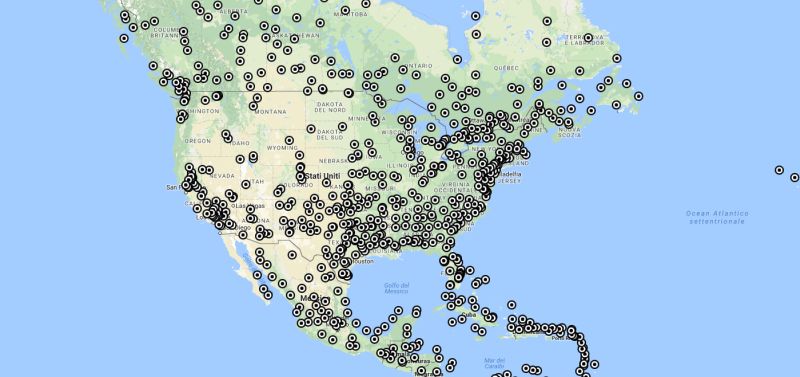
Wind roses for year 2017
We have produced the year 2017 wind roses for more than 2500 locations starting from the automated airport weather observations from around the world. These observations derive from the ASOS network (Automated Surface Observing System) or sometimes from the AWOS network (Automated Weather Observing System). The more generic term METAR describes the format used for transmitting the data. A series of Perl scripts automatically download the meteorological data, analyze them, and create the wind roses.
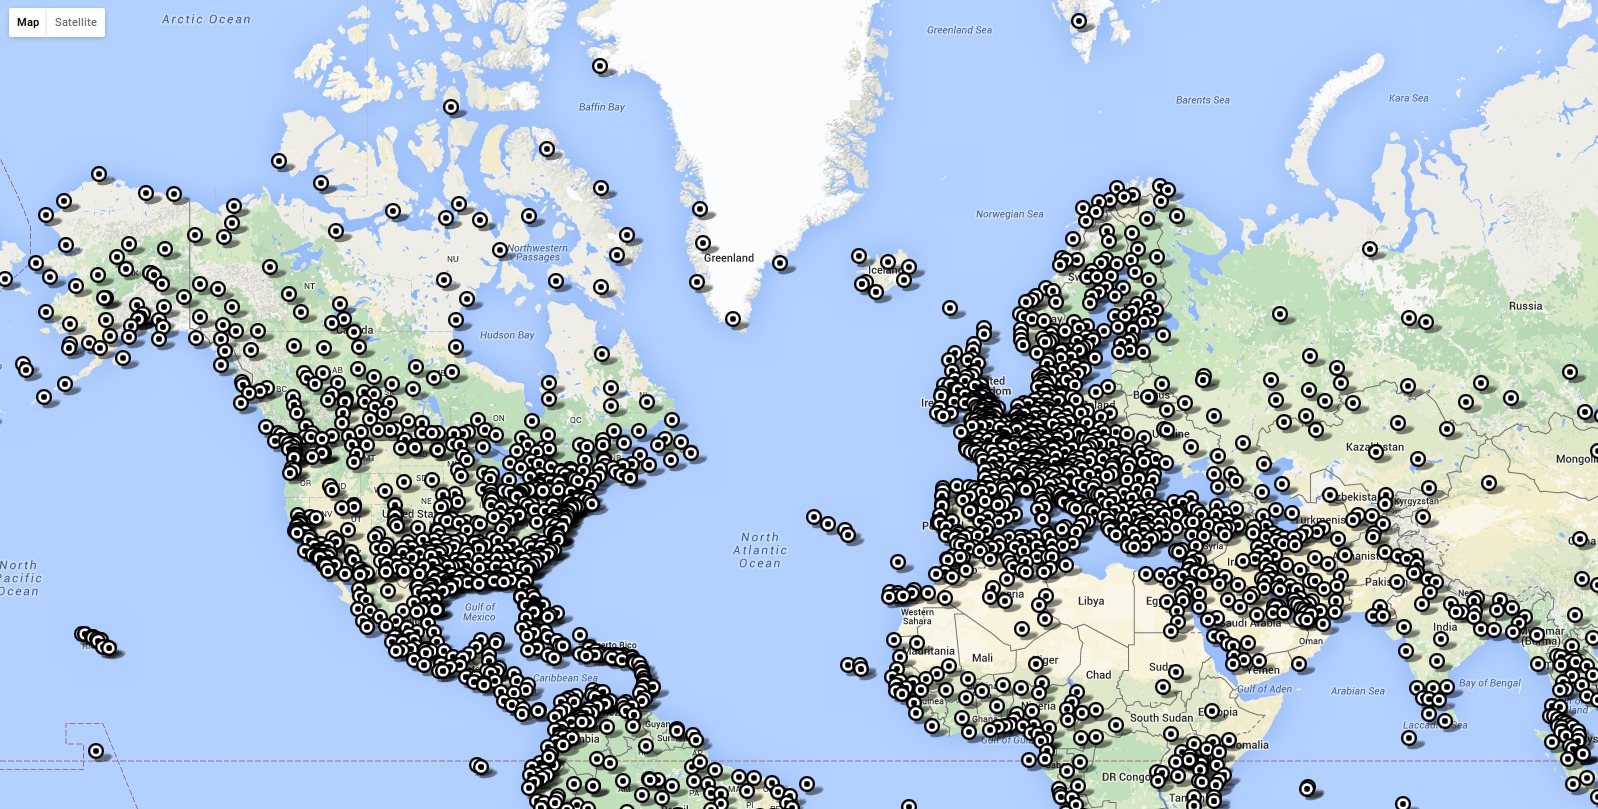
Wind roses for year 2016
We have produced the year 2016 wind roses for more than 2500 locations starting from the automated airport weather observations from around the world. These observations derive from the ASOS network (Automated Surface Observing System) or sometimes from the AWOS network (Automated Weather Observing System). The more generic term METAR describes the format used for transmitting the data. A series of Perl scripts automatically download the meteorological data, analyze them, and create the wind roses.
Plot a wind rose in Excel
A wind rose is a chart which gives a view of how wind speed and wind direction are distributed at a particular location over a specific period of time. It is a very useful representation because a large quantity of data can be summarized in a single plot. In this post we show how to produce a simple wind rose using Microsoft Excel or Open Office Calc. Two sample files are also available.
Read more...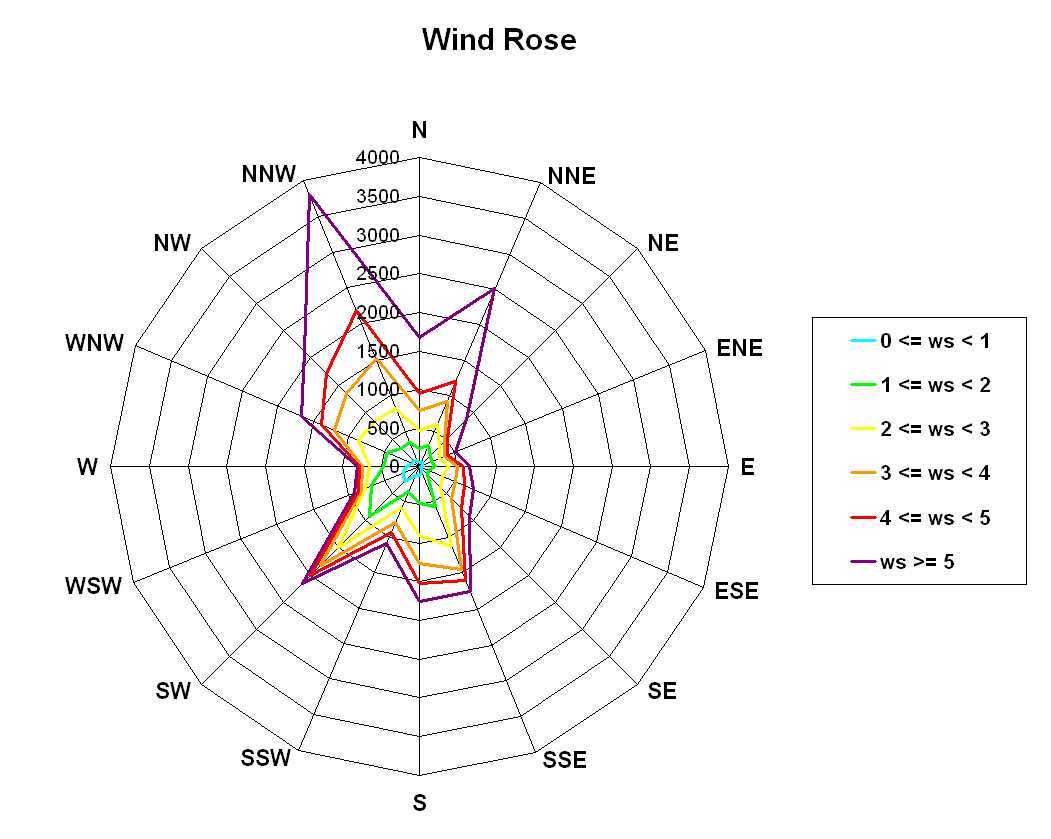
Preparing CALMET GEO.DAT at any location
The land cover information is a necessary input to the meteorological preprocessor CALMET, part of the CALPUFF 7.0 modeling system. THe same for terrain elevation. The land cover and terrain elevation information is input via the GEO.DAT file and it can be prepared by processing a number of data sources using the CTGPROC, TERRAL and MAKEGEO programs distributed with CALPUFF.
Read more...
Wind roses for year 2015
We have produced the year 2015 wind roses for 2490 locations starting from the automated airport weather observations from around the world. These observations derive from the ASOS network (Automated Surface Observing System) or sometimes from the AWOS network (Automated Weather Observing System). The more generic term METAR describes the format used for transmitting the data. A series of Perl scripts automatically download the meteorological data, analyze them, and create the wind roses.
Wind roses 2013 (METAR) Wind roses 2012 (METAR) Wind roses 2011 (METAR)
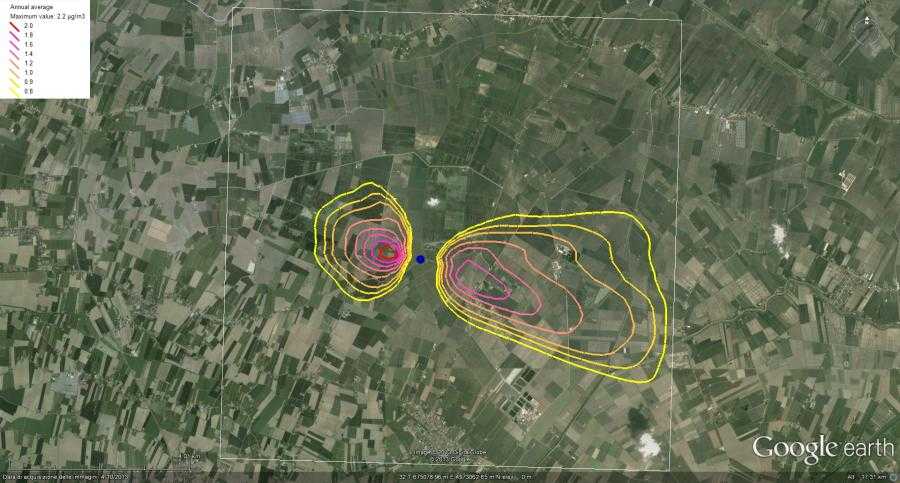
Modelling the impacts of industrial flares
The majority of chemical plants and refineries have flare systems designed to relieve emergency process upsets that require release of large volumes of gas via flaring or venting operations. Flaring operations are the controlled burning of gases, in open flames and open air, in the course of routine oil and gas production. Venting, on the contrary, is the controlled release of gases into the atmosphere, without combustion.
Read more...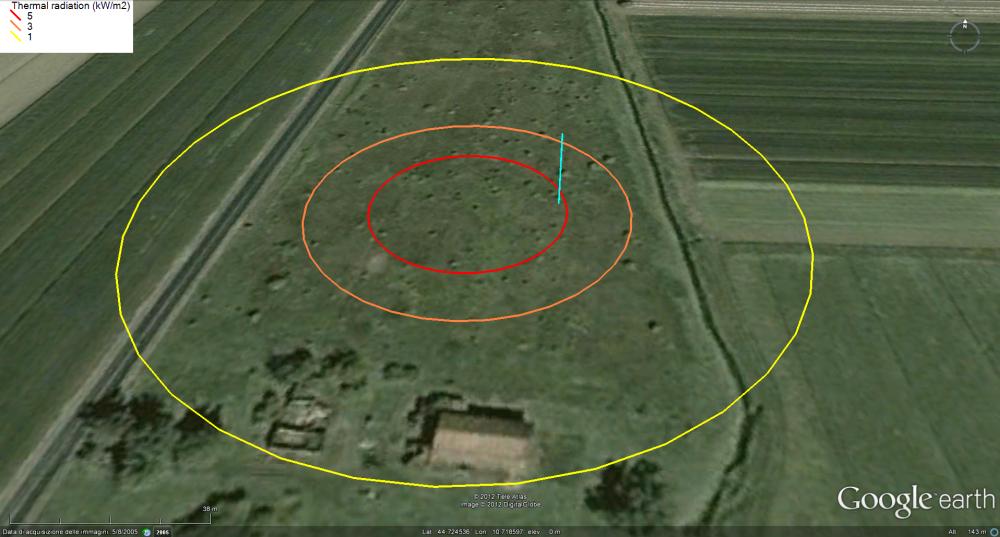
Installing and running WRF 3.8 on Linux Ubuntu LTS 16.04 with Intel i7 8-core cpu
Some indications on how to sucessfully install and run in prarallel (gfortran + MPI) WRF 3.8 on a personal computer.
Read more...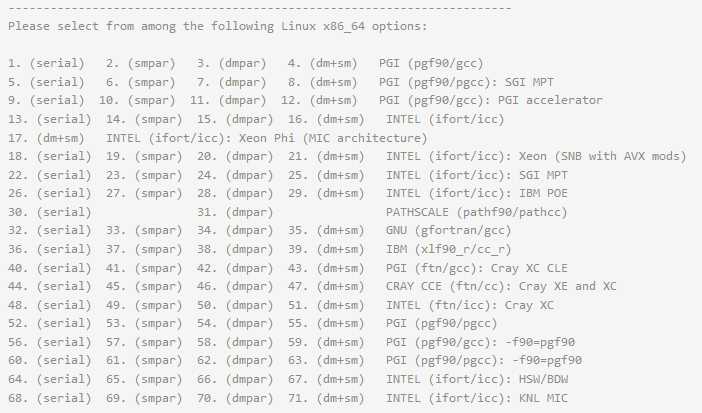
Assessment of the visibility of plumes emitted by stacks
Under certain meteorological conditions plumes with high moisture levels can be visible due to the fact that the entrained ambient air decreases the plume temperature causing the condensation of water vapour. If the visible plume touches the ground, it generates plume induced fogging if the ambient temperature is positive, and plume induced icing if ambient temperature is below 0° C
Read more...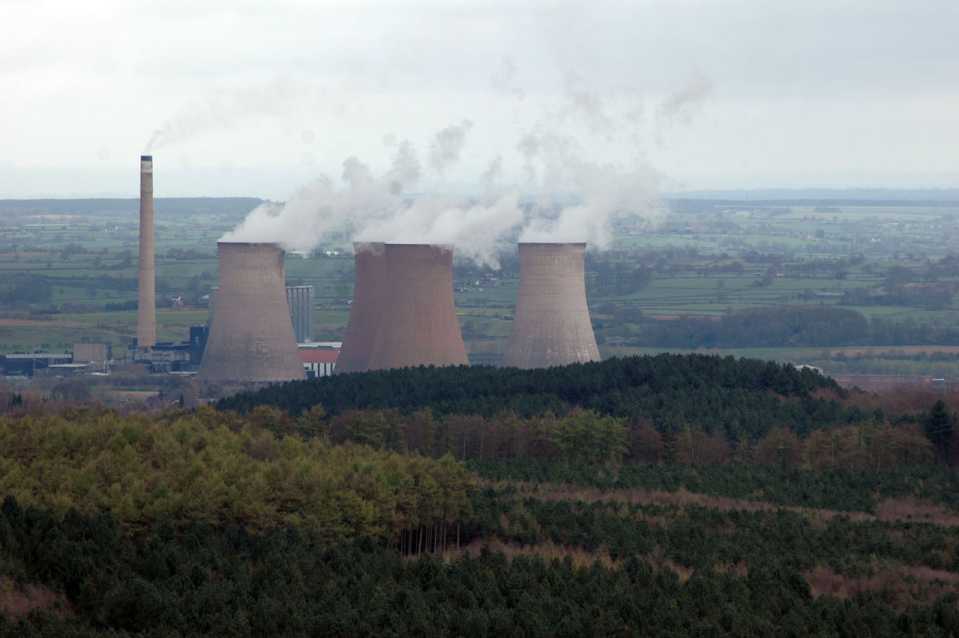
Create your wind roses online
You can use our on line tool for creating wind roses and similar charts for other directional data. Some example data are pre-loaded, in order to show how the tool works. You can simply play with the example data, or insert your own data.
Read more...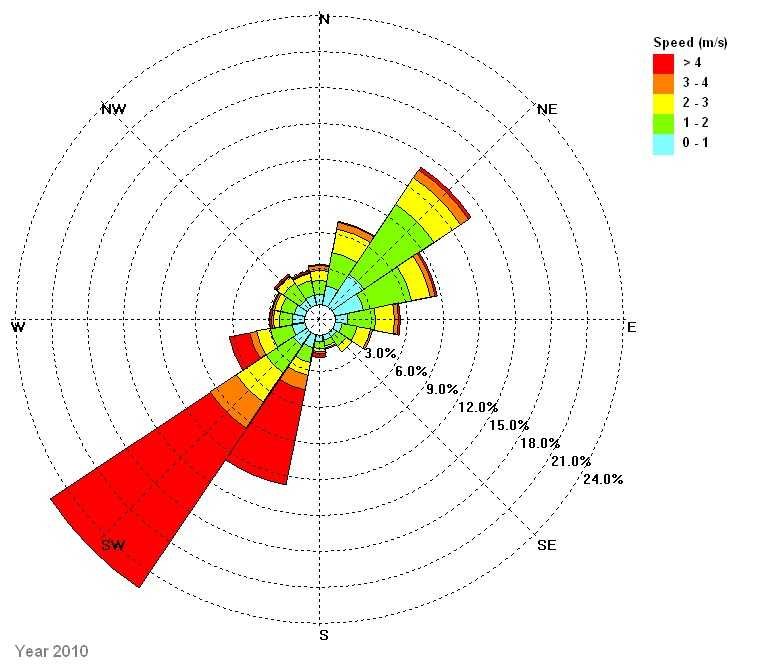
WindRose PRO3 for airports runway design
As described by the Federal Aviation Administration (FAA), wind analysis is of fundamental importance for determining runway orientation. Ideally a runway should be aligned with the prevailing wind in order to minimize the crosswind components. In aviation, a crosswind is the component of wind that is blowing across the runway making a landing more difficult than if the wind were blowing straight down the runway.
Read more...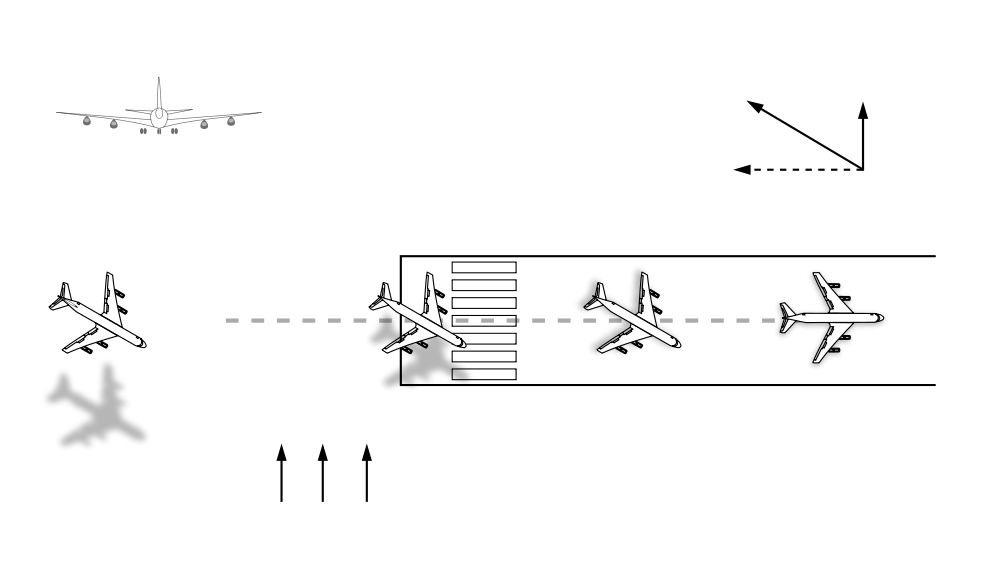
Using ASOS 1-minute data with missing fields with CALPUFF 7.0
The latest version of CALPUFF modeling system by Exponent is available from Exponent, Inc. ASOS 1-minute meteorological data available from NOAA can be used to prepare surface input to CALMET via SURFGEN. Not all ASOS 1-minute data are currently handled by SURFGEN. Here you can find how to use such no-compatilble ASOS 1-minute files.
Read more...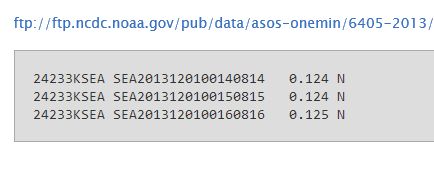
The simplified on-line COPERT4 methodology for calculating emissions from traffic
The methodology is based on the contents of the EMEP/CORINAIR Emission Inventory Guidebook 2007, available on the internet site of the European Environment Agency, more precisely on chapter 7, concerning Road transport. Chapter 7 provides the methodology, emission factors and relevant activity data.
Read more...
A web app for the fast evaluation of the area at risk in case of industrial accidents
SPEDI is a free Web App which allows to determine the effects of possible accidents taking place within industrial plants. Such accidents might involve the release of toxic substances as well as fires or explosions. The algorithms implemented in the app are based on the guidelines published within the Italian law D.P.C.M. 25 February 2005 (Planning of external emergencies for industrial plants).
Read more...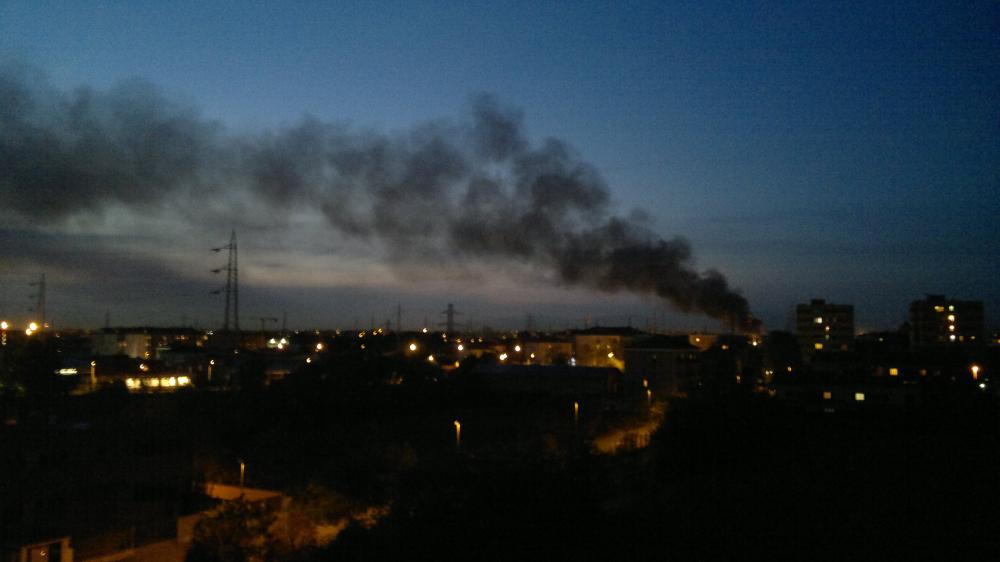
TOXFLAM online - a web tool for air quality modelling
TOXFLAM is a software code based on an analytical solution to the atmospheric dispersion equation for inert substances that may undergo a first-order chemical or physical decay. A simplified version of TOXFLAM is available online on this website, where you can input your data (meteorology, source parameters, domain) and see on Google Earth the results.
Read more...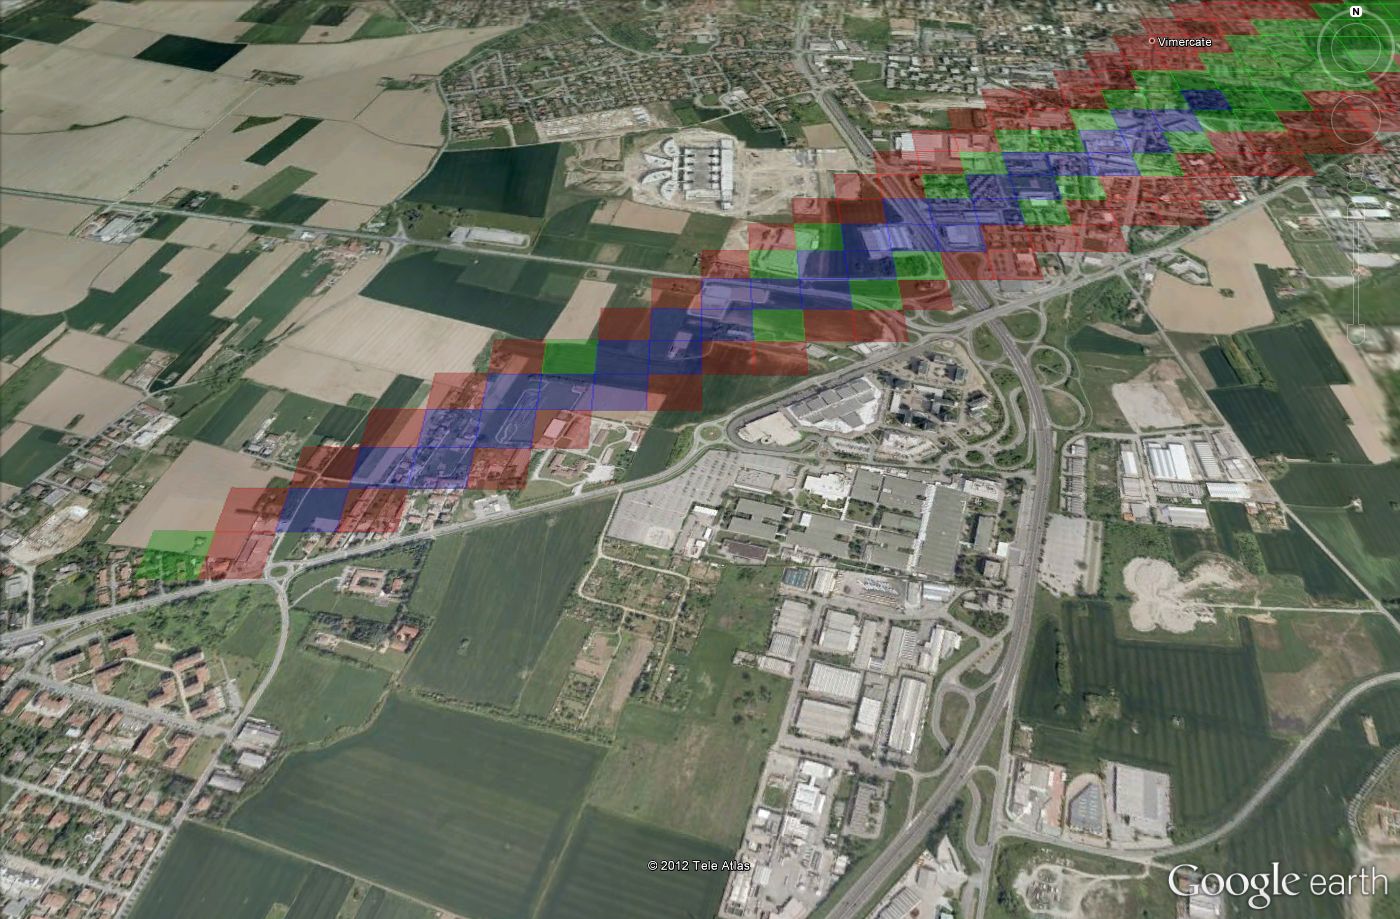
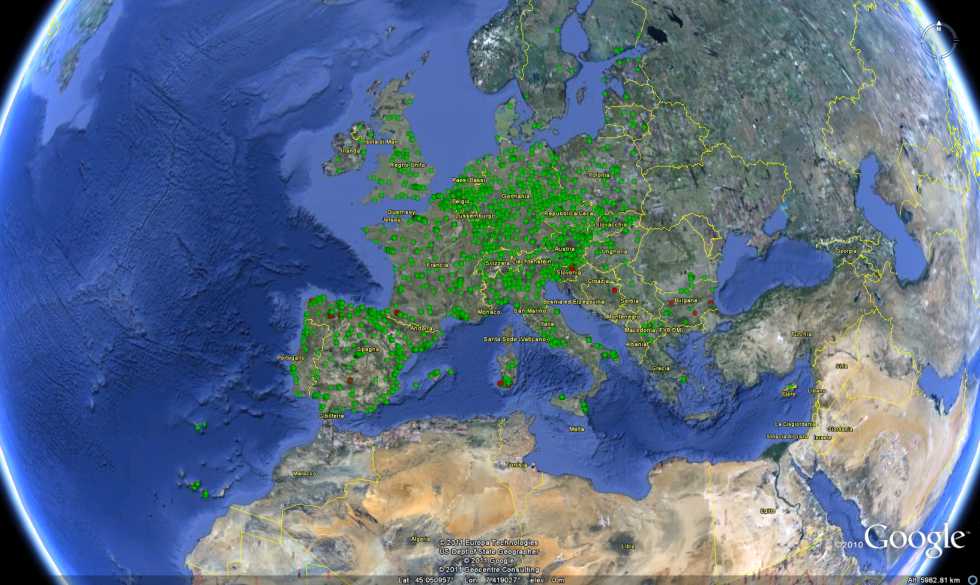
The Google Earth tool for studying Air Quality
Google Earth is a geographic browser, and the KML is its language, just as HTML is the language of the internet browsers. See how it is used to represent air quality and meteorological data.
Read more...
How to use the latest National Land Cover Database 2011 (NLCD 2011) in CALMET
The National Land Cover Database 2011 (NLCD 2011) provides the land cover classification of the United States territory at a spatial resolution of 30m. It is based on the Landsat 2011 satellite data and is the latest of the series started with NLCD2001. The land cover information is a necessary input to the meteorological preprocessor CALMET, part of the CALPUFF 7.0 modeling system. The land cover information is input via the GEO.DAT file and it can be prepared by processing a number of data sources using the CTGPROC program distributed with CALPUFF.
Read more...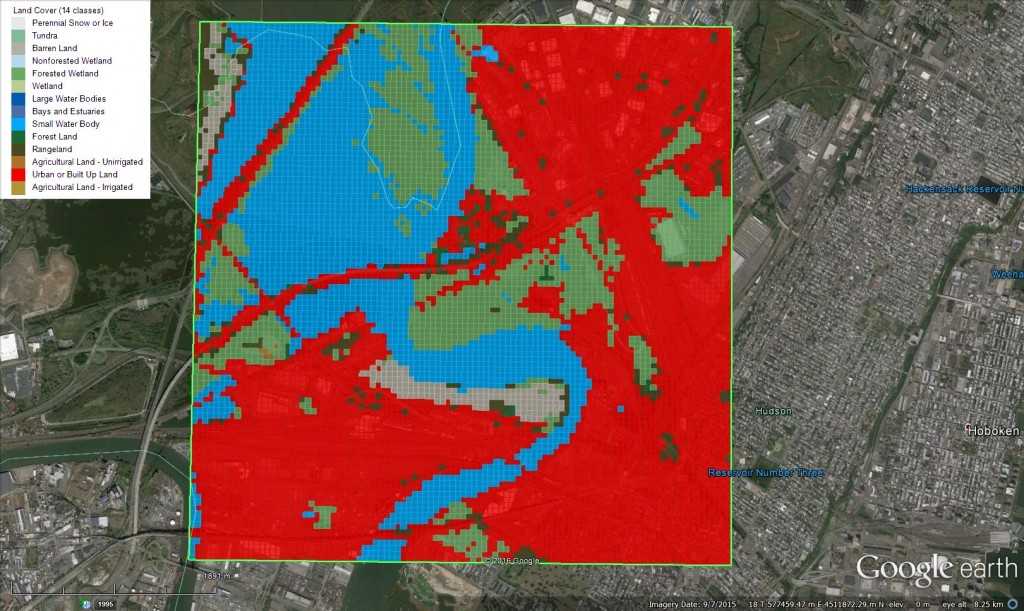
How to use the simple on line wind rose tool
The On line wind rose tool here available let's you create wind roses with 16 directions, each one representing an arc 22.5 degrees wide. The first direction is centred on North (i.e. 0 degree), and the last one on NNW (i.e. 337.5 degree). As usual, the wind direction represents the direction from which the wind blows. The colours of the wind speed classes cannot be modified, they are red, yellow, green, cyan, and blue.
Read more...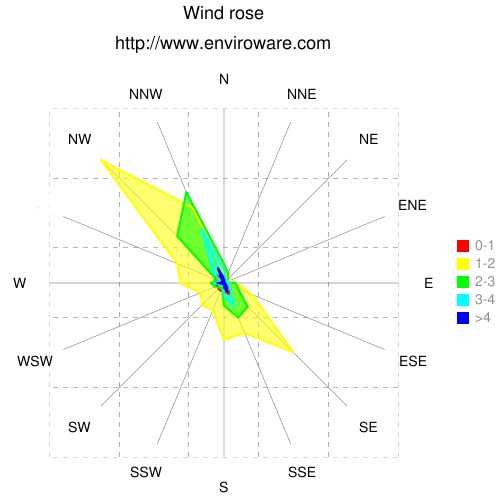
Compiling CALMET and CALPUFF under OS X and Linux
The CALPUFF modeling system is suggested for long-range air quality dispersion model of US-EPA and it is used all over the world as reference model for regulatory purposes in all those contexts where a Gaussian model as AERMOD cannot completely describe the dispersion of pollutants (e.g. complex terrain, non-homogeneous meteorological conditions, calm wind conditions). Exponent distributes the Fortran source code and an executable to be used with Microsoft Windows. In order to compile the distributed source code under Linux and OS X with the free GNU Fortran compiler gfortran it is necessary to make some fixes to the source code, otherwise there is a segmentation fault error that prevents a successful compilation.
Read more...
Use WindRose PRO to produce a 3-variables plot
In a 3-variables plot WindRose PRO represents the third variable with circles of different colors which are placed at a radial distance given by the wind speed (or any other directional variable), and at an angular coordinate given by the wind direction (measured from North and increasing clockwise). This kind of plot can be used in air quality studies for estimating the presence of important sources of specific pollutants.
Read more...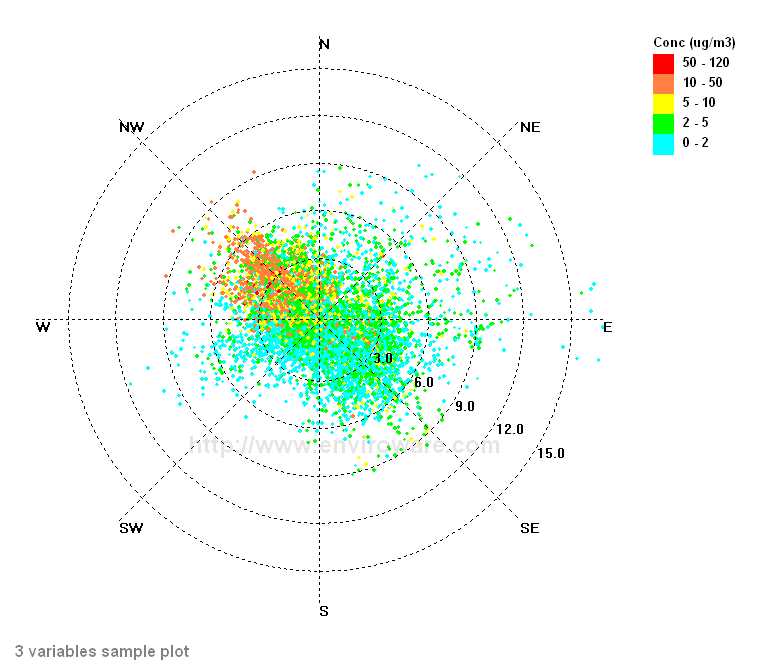
The application of models under the European Union's Air Quality Directive
A new technical report has been released by the European Environment Agency (EEA) concerning The application of models under the European Union Air Quality Directive.
Read more...
Using CALPUFF with a single station meteorological file
The preferred meteorological preprocessor of the CALPUFF dispersion model is CALMET. CALPUFF can also use single station meteorological data, for example in AERMOD format. When using the single station data the meteorological field is spatially uniform along the horizontal and this has some limitations.
Read more...