Introduction
WRF Browser is a freeware Windows application for extracting, decoding and representing NetCDF WRF output data. It is an interface to the Unidata’s netCDF-C Libraries, which must be installed on the user’s PC.
The user must download the pre-built netCDF-C Libraries from the Unidata’s web site and install them on her/his PC. WRF Browser does not require to add the netCDF libraries directory to the system path. WRF Browser has been developed for netCDF4. We recommend to download one of the files netCDF4.6.3-NC4-DAP-XX.exe, where XX may be 32 or 64, depending on the PC where the libraries will be installed. Actually the users could install the libraries without the DAP support, but we are planning to include DAP features in the next releases of WRF Browser.
System requirements
WRF Browser is a Windows application that can be used both on 32 bit and 64 bit platforms. It is based on the .NET framework 4, which must be present on the PCs where it is installed. In the remote case your PC does not have the .NET framework 4 installed, you can get it from the Microsoft Download Center.
WRF Browser has been tested by the developers under Windows Vista and Windows 7. It has not been tested under older versions of Windows.
It may or may not function correctly under any Windows emulator of Mac, Linux or Unix systems.
To install WRF Browser from the distribution setup package, simply double click over the setup file. The Setup program will issue a number of prompts. Unless you have a reason to override the defaults it is strongly recommended that you accept the installation default settings (just press OK, Yes, or Next, as appropriate).
To uninstall WRF Browser use the Control Panel as for any other application.
Support and questions
Check whether you have the most recent version of WRF Browser.
The best way to report problems is to send an email to info@enviroware.com (you can also use the feedback button on the software).
When reporting problems, please include at least the following information:
- Is the problem reproducible? If so, how? (Please include the input data or get in contact so we can provide you a link to upload your files).
- What version of Windows are you using?
- What version of WRF Browser are you running? (To see what version of WRF Browser you have, choose the About button). Please include version number and date in your problem report.
- If a dialogue box with an error message was displayed, please include the full text of the dialogue box, including the text in the title bar.
Tutorial
If you want to test the software while reading the tutorial you can use your own WRF output, or download a simple example (about 61 MB) which refers to the Hurricane Katrina test simulation described in the WRF ARW on-line tutorial.
Main form
The main form of the WRF Browser software is represented in the next figure.
There are four menu topics:- File: allows to define settings and load NetCDF WRF files.
- Log: allows to carry out some operations on the log screen (alternatively right click on the log screen, and its contextual menu will appear).
- Map: allows to carry out some operations on the map screen.
- Help: allows to access the User's Guide (this document), to send feedbacks and to view information about the software.

Automatic updates
Provided an active internet connection is available, every time the software starts it automatically checks if a new version exists. If such a new version exists, a form with some information appears and the user may decide to download it (Download button) or to skip the operation (Not now button). During the download a Cancel button is activated which allows to stop the operation.

The download folder differs according to the Windows version, therefore it is indicated both within the form and at the end of the download operation. At the end of the download the user must close WRF Browser before installing the new version.

Settings
The first operation to perform before using WRF Browser is to define a working folder and the folder containing the executables of the Unidata’s netCDF-C Libraries. Without these two folders the software cannot work. The user must have reading and writing permissions for the working folder because several files are written-to and read-from there. The working folder may be a subfolder of C:\tmp\ for example
C:\tmp\wrk\The executables folder depends on your choices during the installation of the Unidata’s netCDF-C Libraries. Normally it is
C:\Program Files\netCDF 4.4.0\bin\It is also possible to specify the temperature units, which by default are Kelvin.
These choices are saved in the program settings and must be defined only once. Use the File > Settings menu item to set or modify your values (see next figure as an example).

Load WRF data
NetCDF WRF data may be loaded through the File > Load menu item. By default WRF Browser expects them with a *.nc extension, but any other extension can be used. Immediately after the selection of the WRF file, the software starts to decode it. After the decoding some elements of the main mask become enabled (buttons, droplists) and the log screen is filled in with information.
There are typically four types of variables: depending only on time, depending on time and on the vertical direction (Time dependent 1D), depending on time and on horizontal position (Time dependent 2D), and depending on time and on position in the space (Time dependent 3D). The user first must select one of these groups by means of the radio buttons, then may select a specific variable by means of the variables drop list.
Alternatively the special variable Wind may be selected, which forces the software to calculate wind speed and wind direction at 10 m a.g.l.

The kind of NetCDF file (i.e. the format variant the file uses) is reported at the beginning of the log screen. Such a kind may be one of these four: classic, 64-bit offset, netCDF-4, or netCDF-4 classic model. The current version of WRF Browser should work correctly with files of all the four kinds. Please remember that the software reads NetCDF files when they are output of the WRF model, it does not read any NetCDF file.
Extract values
When a variable is selected by means of the droplist, its information is automatically written in a series of read-only text boxes, as shown for example in the next figure for T2.

The Get values button extracts the values of the selected variable for all the times and all the points where it is calculated. This button therefore can be used before the selection of a specific date/time or vertical level (for 3D variables), and in any case those selections do not affect the extraction (i.e. all the values of the variables are extracted in any case).
Export values in CSV files
After the values of a specific variable are stored in memory, it is possible to select a specific time and export all the values in a CSV (Comma Separated Values) file through the Export values button. Each record of the CSV file is composed by three fields representing respectively the values of latitude, longitude and of the variable itself. The next figure (top part) represents an example for T2. If the special variable Wind is selected, each record is composed by four fields: latitude, longitude, wind speed (m/s) and wind direction (degrees), as shown in the next figure (bottom part).


Creating maps
Time dependent 2D variables calculated on mass point can be represented over the WRF Browser embedded map (internet connection is needed to load the map tiles). Variables calculated over staggered grids cannot be represented by the current version of the software. The Create map button activates the Map settings form represented in the following mask.

The user must select a color ramp with colors and values suitable for the variable to represent. To help the user to select a suitable color ramp the minimum and maximum values of the variable over all the times are written in two different read-only text boxes.
Several color ramps are distributed together with the software and are placed in the following folder (that might be different for different Windows versions):
C:\ProgramData\Enviroware\WRF_Browser\ColorRamps\
Color maps are ASCII files composed by many records (no more than 300 for WRF Browser), each record consists of five space-separated values: the variable value and corresponding Red, Green, Blue, Alpha components (color and alpha components between 0 and 255). An alpha component equal 0 means full transparency, while an alpha component equal 255 means full opacity. An example is provided below (note that the first record must correspond to the highest value):
90      255  30   0 255
89      255  30   0 255
89      255  41   0 255
88      255  41   0 255
88      255  52   0 255
87      255  52   0 255
The user may create personal color ramps provided the format described above is respected. Each color ramp file must have a pg extension (PostGIS format). Alternatively color ramps can be downloaded from the Internet, for example from this site.
In any case color ramps must always be within the directory specified above, and WRF Browser will load them automatically.
It is possible to overwrite the opacity specified in each level of the color ramps with a single value (form 0 to 255) specified in the mask.
By selecting the Create map radio button and clicking the create (green) button, the map is automatically created and shown. The next figure represents the map of T2 for the Hurricane Katrina example at 2005-08-28 06:00 GMT.

The legend can be moved over the map by dragging it with the mouse. The legend can also be copied or saved, independently from the map, by clicking over it with the right mouse button and using the contextual menu.
The whole map can be copied or saved by means of the Map menu item.
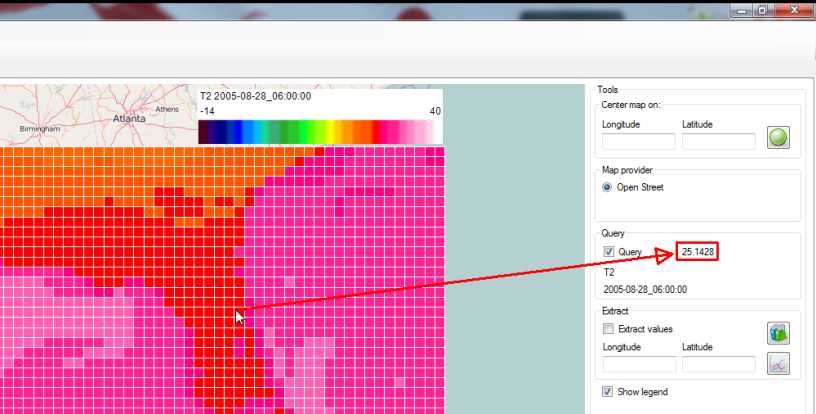
Querying values
Once the map is created, it is possible select the Query check box to query values in real-time by simply moving the mouse pointer over the map. The values are shown on the right map panel, are represented in the next figure. Actually, this operation is possible even without the generation of the map, provided the data have been extracted and a date/time has been selected.
Time series charts
Time series chart can be created by specifying a point of extraction, writing its coordinates or clicking over the map, provided the Extract values check box has been selected.

After that, the chart is generated by clicking over the button next to the latitude field. A simple example is shown in the next figure.

The charts have a right panel with elements which allow to modify their features, as shown in the next figure. Such elements are within five groups according to the features that they control: Chart title, Legend, X Axis, Y Axis and Y Series. After each modification, the new features will appear on the chart by clicking the apply options button (the one with two green arrows).

The chart can be copied, saved and printed by means of the three buttons placed at the bottom of the chart options.

The possible file formats to save the chart are:
BMP Windows Bitmap
JPG JPG/JPEG Format
GIF Compuserve GIF
EMF Enhanced Metafile Format
PNG Portable Network Graphics
TIFF Tagged Image File Format
Note that by clicking over the chart and dragging the mouse pointer it is possible to zoom over a specific part of the data. Once zoomed, it is possible to move the series of data to the left or to the right by means of the arrows within the blue circles at the bottom of the chart. The small circle placed at the bottom right part of the chart allows to undo the zoom of one step each time it is clicked.
Time series CSV files
Time series can be exported in CSV files by specifying a point of extraction, writing its coordinates or clicking over the map, provided the Extract values check box has been selected.

After that, the chart is generated by clicking over the button highlighted by a red square. By default the proposed CSV file name is composed by the variable name and by the point coordinates, for example T2_80.9253W_28.1689N.csv. A simple example of the resulting CSV file is shown in the next figure.

Export KML
The same procedure described for creating a map is used for exporting a KML file for Google Earth. The only difference is that the Export KML radio button must be selected before clicking the button.

Two examples of KML files exported by WRF Browser are shown in the next figures. By clicking over a point of the KML map, a pop-up with the value interval in such a point is activated.


Help
The Help menu item allows to access the user guide (this document), to send feedback and to view information about the software.